Allocating capital within planetary boundaries


Planetary boundaries are now part of the operating environment of every large company. Most capital-allocation methods have been built in a context where climate- and nature-related risks and dependencies were not sufficiently material to be embedded in business planning. This paper sets out how to extend them: start from what each business activity depends on and what it affects, then quantify that exposure and integrate it into financial steering.
The economy depends on systems it does not price
Seven of the nine planetary boundaries are now breached [1]. The financial relevance is direct. Between $42 and $44 trillion of global GDP, about half, depends moderately or highly on nature [3]. That dependence sits in the portfolios that finance the economy: 85% of the companies in the S&P Global 1200 show significant dependence on nature, and nearly 75% of euro-area bank loans go to companies highly dependent on at least one ecosystem service [5].
These figures measure vulnerability, meaning how far activities and portfolios rely on nature. Losses are the consequence of that vulnerability, and their size depends on how it is managed. For a company, vulnerability shows up in three places: operating cost, credit terms and insurance cover. Insured natural-catastrophe losses reached $107 billion in 2025, 92% of them from secondary perils such as floods, storms and wildfires, and the protection gap stands at $424 billion [7]. Disclosure is moving in the same direction: more than 1,000 organisations now report against the TNFD framework, and the ISSB is preparing a nature-related standard, likely in 2027 [9].
Start from what the business does
A single company-wide materiality score does not show which site, activity or project is exposed, so it cannot guide a capital decision. Activity-based materiality works at the level where capital decisions are taken, in three steps.
- Decompose. Break the business into activities: sites, processes, inputs and suppliers.
- Map. For each activity, identify the few boundaries it materially depends on or affects, after a quick screen of all nine, and where several of them meet on the same site or supplier.
- Size. Translate exposure into dollars on the five financial channels: revenue, operating cost, capex, cost of capital and asset value.
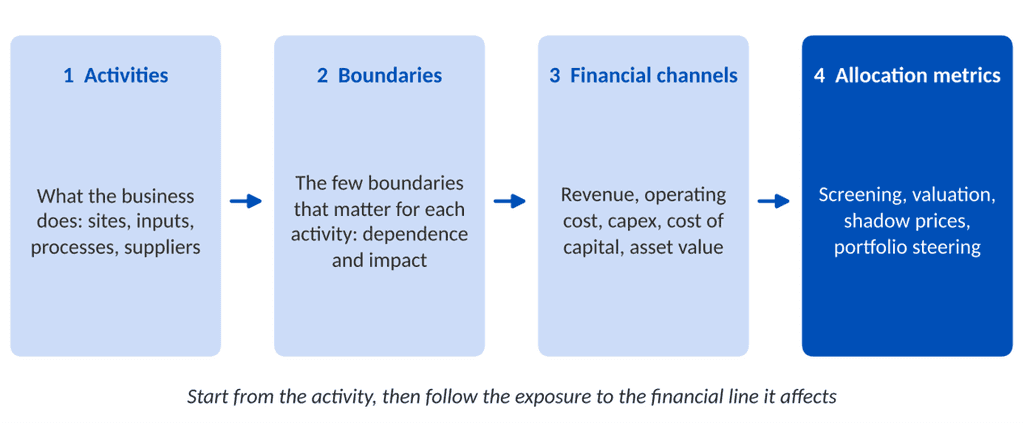
Exhibit 1. From activity to allocation metric. Source: Blunomy analysis.
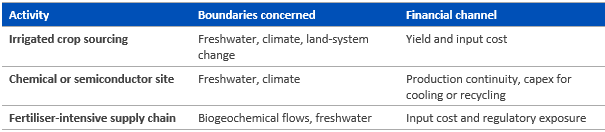
Illustrative examples of what the mapping produces:
Decision-grade granularity
Detailed life-cycle assessments serve product design and reporting well. For decision makers they are too granular: decision makers need a ranked view of the few activities and sites where the numbers move. The test is decision-grade: detailed enough to change a ranking or a budget line, and no more. In practice this means tens of activities rather than thousands of data points, with further detail added only where a ranking is close or the amount at stake is large.
Four evolutions of capital-allocation methods
Activity-level materiality changes four steps of the allocation process, without adding a new process.
- Screen. Add activity-level exposure as a gate before the investment committee, so that a project in a stressed catchment or on a threshold input is flagged early.
- Value. Restate cash flows for expected disruption, compounding and impact charges.
- Price. Set internal shadow prices on material impacts, by activity, as many companies already do for carbon.
- Steer. Allocate across the portfolio on three levers: protect activities with high dependence, transform those with high impact, and capture the opportunities the boundaries create.
Illustration: where the analysis raises strategic questions. Two recent public episodes show the kind of question that activity-level analysis puts in front of decision makers before an event rather than after it:
- Chip manufacturing and water, Taiwan, 2021. Authorities called it the worst drought in the island’s history and said that, if rain stayed short, companies in the Hsinchu and Taichung science parks would have to cut water use by 17%. TSMC reported no impact on production, trimmed its water use and bought water by tanker truck for some foundries [16]. The strategic questions (Blunomy analysis): how much water security should weigh in choosing a site, what recycling investment is justified, and what continuity of supply is worth.
- Shipping and the Panama Canal, 2023. The canal capped the draft of Neopanamax ships at 44 feet and reduced daily transits to about 30, from 36 to 37 on a good day, so some carriers had to lighten their loads [17]. The strategic questions (Blunomy analysis): how exposed route, port and fleet investments are to a single chokepoint, and what alternative routes or inventory buffers are worth.
In both cases the exposure could be read from where each activity sits and what it depends on. The analysis turns it into a decision on site, route or capital expenditure.
Public precedents and what they teach
Several public initiatives provide foundations. Each also shows where implementation is demanding.
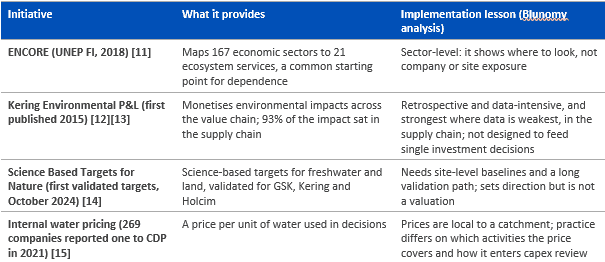
The common lesson is to keep the method simple enough to run inside existing processes, and to apply detail where it changes a decision.
Conclusion
Planetary boundaries turn nature from an externality into a financial variable. The companies best placed will be those that quantify it at the level of activities and carry it into the numbers that steer capital.
Takeaways for action
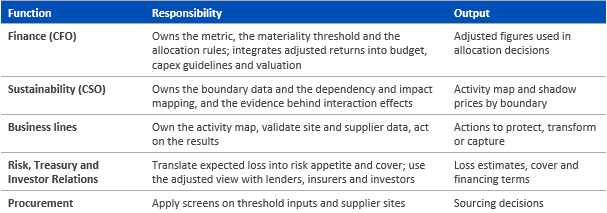
- Scope. The CFO and the CSO choose the one or two business lines where dependence on nature is highest and map their activities.
- Quantify. Express the exposure of those activities in dollars on the five financial channels, and rank sites and projects on it.
- Embed. Bring the ranked view into the next budget or capex review, as a screen first and as an adjustment to valuation later.
Authors:
By Sébastien Guillo, Partner Financial Institutions & Climate Risk and Fabiola Graveaud, Partner Impact & Scientific Methods at Blunomy.
Sources
- [1] Planetary Boundaries Science (PIK), Planetary Health Check 2026, 22 September 2026.
- [2] Stockholm Resilience Centre, Seven of nine planetary boundaries now breached, 24 September 2025.
- [3] Swiss Re Institute, Biodiversity and Ecosystem Services Index, 28 September 2020.
- [4] World Economic Forum, The Future of Nature and Business, 2020.
- [5] European Central Bank findings on nature-loss risk to euro-area banks, reported by the World Economic Forum, June 2023.
- [6] S&P Global Sustainable1, How the world’s largest companies depend on nature and biodiversity, 10 May 2023.
- [7] Swiss Re Institute, 2025 insured natural-catastrophe losses.
- [8] Swiss Re Institute, natural-catastrophe protection gap, June 2026.
- [9] TNFD Status Report 2026, 23 September 2026.
- [10] TNFD, ISSB decision on nature-related standard setting.
- [11] UNEP FI, ENCORE tool for financial institutions, 26 November 2018.
- [12] Kering, Environmental Profit and Loss results and open-source methodology, 20 May 2015.
- [13] WBCSD, Kering Environmental Profit and Loss accounting.
- [14] SBTN, first validated nature targets: GSK, Kering, Holcim, 31 October 2024.
- [15] CDP, Internal water pricing is changing how companies do business, 26 August 2022.
- [16] CNBC, Taiwan steps up curbs on water use by chip hub Hsinchu during drought, 19 May 2021.
- [17] gCaptain, Panama Canal to keep limits in place as drought hits lake levels, July 2023.
- [18] Blunomy analysis: activity-based materiality approach and interpretation of the public examples.